

Enlightened Financial Management: Visibility, Real-Time Insights, and Dynamic Dashboards
Publié
Le 11/06/2024, par :
- Fabio
Sections
Contexte
In the intricate world of financial management, Chief Financial Officers (CFOs) face a significant challenge: juggling an incessant flow of data while ensuring impeccable precision and proactive management. In this scenario, a complete visibility of tracking indicators within financial management software proves indispensable. Let’s dissect the major challenges of this visibility and the importance of having relevant dashboards for financial oversight.
360° Visibility, Automated Dashboards, and Reporting: What do CFOs need ?
Companies churn out mountains of financial data every day. This volume is so substantial that it requires a synthesized overview. Without an efficient process, tasks like data extraction and sorting become quickly tedious. In every data process, the steps typically involve extraction, sorting, verification or correction, and then analysis. For instance in the case of financial reconciliations (bank reconciliation, transaction reconciliation, or stock reconciliation), data reconciliation adds to these steps, bringing other needs along.
The Pursuit of Precision: In the financial world, precision is paramount. From strategic decisions to regulatory reports, even the slightest error can have enormous repercussions. Hence, CFOs have a need for precision, verification, and correction.
Real-Time Monitoring: Companies operate at a frenetic pace, with deadlines to meet and fixed accounting closure periods. In this pursuit of precision, being able to track financial activity in real-time is essential for monitoring and steering activity.
Early Detection of Issues: Prevention is better than cure. To anticipate and organize, detecting problems at an early stage is an undeniable advantage. Early visibility allows CFOs to quickly correct errors before they escalate.
Faced with these needs, complete visibility with efficient tools, relevant automations, and precise, real-time dashboards are prime assets for CFOs. They are then equipped for effective data management.
Activity and Performance Tracking
Tracking Business Activity
Spending hours extracting and sorting data before beginning analysis is no longer practical. In most professions and the vast majority of tools, these steps are automated to focus on analysis. For a precise and automated overview of financial activity (transactions, stocks, reconciliations, etc.), dynamic dashboards prove highly effective. Besides saving working hours, they provide synthesis, real-time tracking, and a direct view of issues to address. Thus, they meet the three previously mentioned needs.
Tasks preceding analysis—collecting, sorting, reconciling—are largely automated and generally performed by the rest of the accounting team. Consequently, the dashboard supports CFOs for the remaining steps of the process:
. Analysis – Correction and justification – Communication – Archiving
For analysis, a synthetic, precise, and real-time view allows easy problem detection.
For the correction stage, dashboards help quickly identify and address issues but also allow CFOs to take a step back and look at the bigger picture. They can spot trends or recurring errors and react comprehensively on a global level, by changing processes or providing further training or information to their teams.
For easier communication with the rest of the company, in a clear and understandable manner, dashboards are also of great assistance. They visually present various finance department findings for other business areas. With efficient centralization and accessibility, they facilitate information flow within the company, serving as a common basis for decision-making. Dashboards and collaboration thus go hand in hand.
Lastly, all these precise data and analyses must be archived and stored. Not only to meet regulatory requirements but also to have a thorough basis for future analyses. Here, dashboards allow comparisons over a given period and keep synthetic reports from the past.
Monitoring Team Performance:
In addition to their role in activity management, dashboards are also used for managerial reasons. Having automated dashboards enables better tracking of team performance and productivity. For example, seeing the number of transactions remaining to reconcile, reconciled accounts or business units per person, etc.
Monitoring Team Performance
In addition to their role in activity management, dashboards are also used for managerial reasons. Having automated dashboards enables better tracking of team performance and productivity. For example, seeing the number of transactions remaining to reconcile, reconciled accounts or business units per person, etc.
Master and optimize your financial management with the new Calixys platform
The Calixys teams have brainstormed to facilitate and improve the tracking of companies‘ financial activities. It is by delving deeper into this reflection that a new version of the platform has been launched.
A Summary at Your Fingertips: Overview Dashboards
In this new version, dashboards have been completely redesigned for better visibility, accessibility, and smoother reading. Thus, from the homepage of the XREC platform, the most relevant data for monitoring is brought forward.
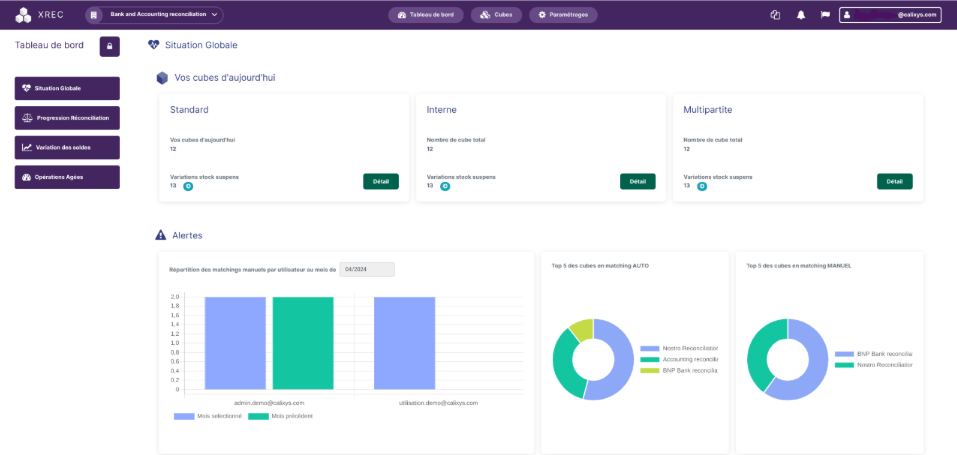
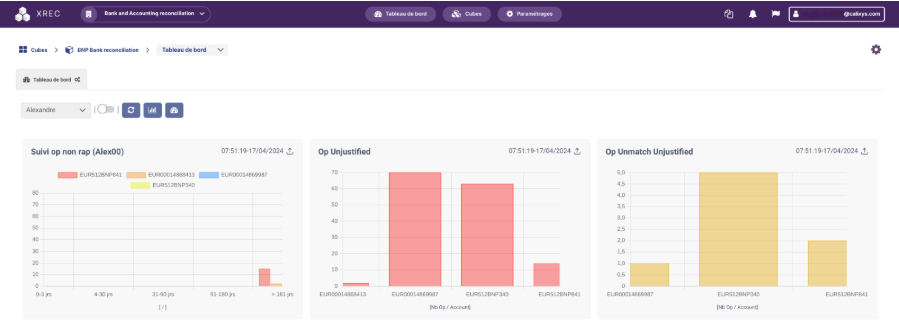
The dashboards displayed on the homepage vary according to the defined role at login. Indeed, on the XREC platform, there are several access profile options, so different profiles lead to a different view of the homepage.
Administrator view, for example, may display automated dashboards of platform activity rates, the number of new users, or the number of reconciliations performed in the month.
On the business manager view, dynamic dashboards may show failing matching rules, the top 5 performing matching rules, or the bottom 5 performing rules.
Simplified Reconciliation Monitoring: Specific View Dashboards
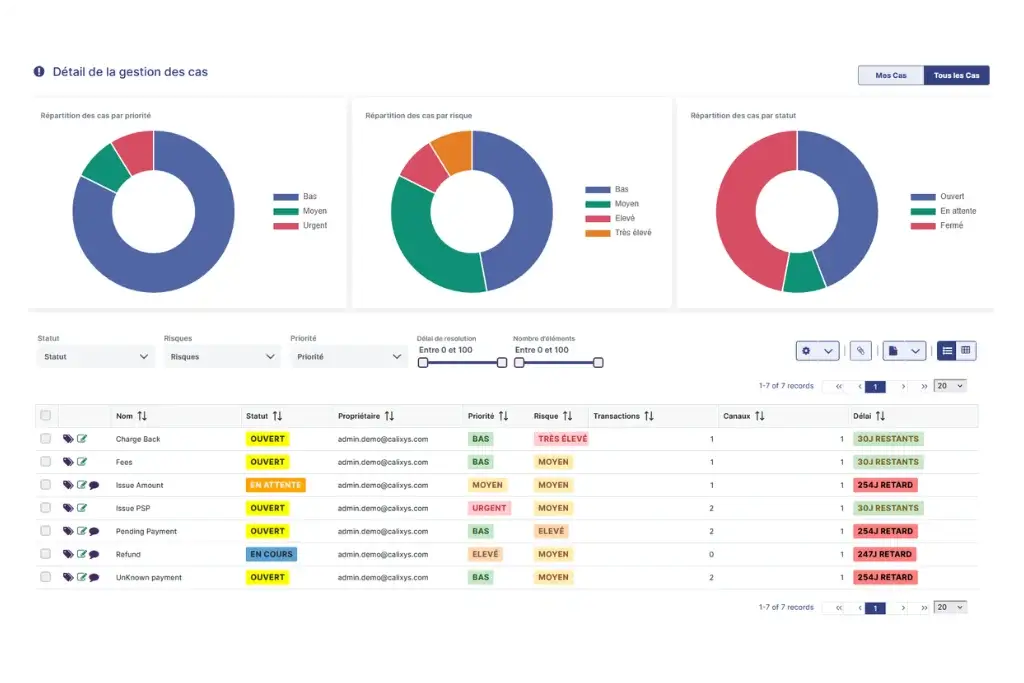
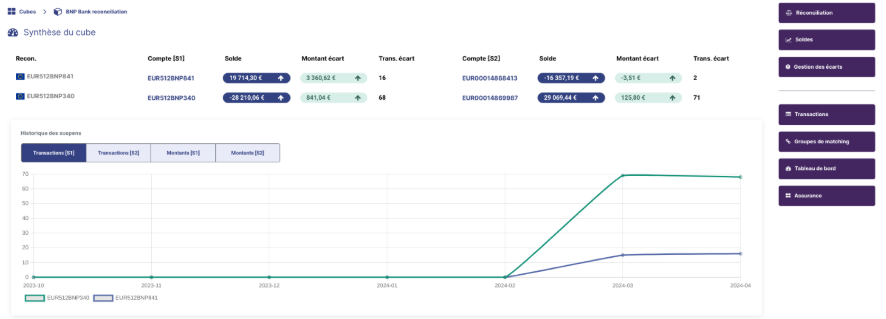
In addition to the dashboards on the homepage summarizing overall activity monitoring, there are also dashboards for each of the cubes.
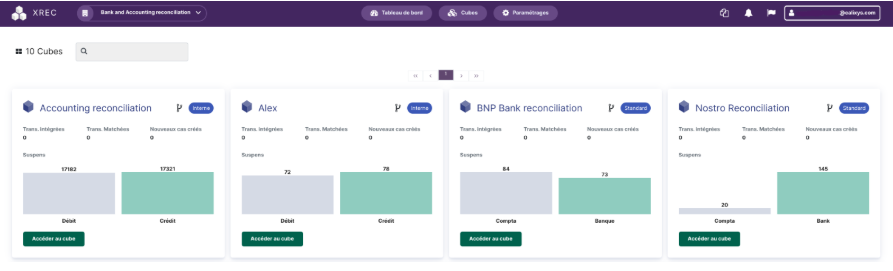
A cube in the XREC platform corresponds to a reconciliation. So, for each cube, it is possible to set up dashboards to summarize the number of “matched” transactions, the number of exceptions, the type of error, etc. These dashboards are 100% configurable. Business users as well as managers can define monitoring processes together and create custom dashboards to track the most relevant data for their activity and obtain the desired level of detail.
It is thus a precious time-saving approach that this accessible summary offers to the entire team.
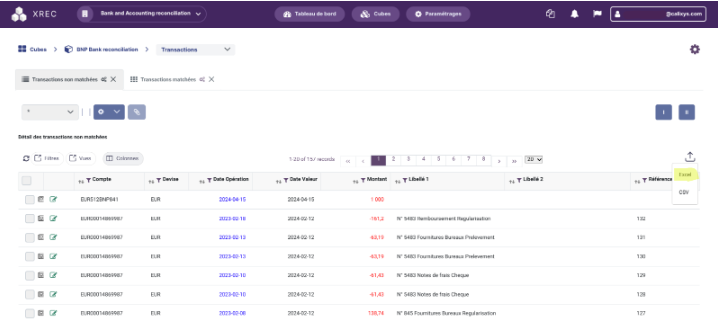
Improved Collaboration: Export, Share, and Analyze
Each of these dashboards on the platform can be exported in several formats. This facilitates report creation and analysis archiving. Thus, communication with other departments of the company is made more efficient. It is now possible to rely on a valuable ally when making decisions: a visual and understandable rendering for all teams.
The dashboards are dynamic and refreshed at regular intervals (defined in advance by the teams and configured in the software), which also allows real-time tracking and in 3 clicks of financial activities.